The “M” in ICM: Using ATP to Evaluate Sanitation
In my last column, I introduced the concept of integrated cleaning and measurement (ICM) as a way of objectively evaluating and improving cleaning activities and methods. ICM is an open-ended model that relies on a series of “experiments” in which we can compare different sanitation strategies to find those that are the most cost-effective and cost-efficient for the specific food operation. ICM makes the Sanitation Standard Operating Procedures (SSOPs) a living document.
The concept of integrated cleaning, or the “IC” part, is fairly well understood. It is the “M,” or measurement, that poses some difficulty in application and interpretation. While economic measurements are relatively straightforward, this is not so when it comes to measuring cleanliness. Here is the problem: while there are many tools available to us in establishing quasi-objective and even objective measurements for chemical and physical cleanliness, we rely largely on adenosine triphosphate (ATP) monitoring as a rapid, inexpensive way to determine relative levels of biocontamination.
The ATP-monitoring system is a new and exciting technology that shows great promise in aiding both the regulator and the retail food industry. Because it presents a logical approach to measuring cleanliness, I predict that ATP monitoring will become part of the sanitarian’s standard repertoire before too long. But, because of the technology’s newness, each device is quite different from the others on the market. There are no established protocols for their operation; each manufacturer develops its own. There are no standard sensors, swabs, measurement scales or sampling systems, and according to the pundits within the ATP industry, it does not look as if there will be any in the near future.
Given that ATP monitoring is a new technology, the regulatory community has not fully embraced its use, nor has the industry collectively shared data on its application or interpretation in situations where it has been used successfully. In addition, neither industry nor regulators have tended to apply simple statistical and sampling strategies to eliminate bias when evaluating any sanitation program. While most sampling protocols for microbiological detection are fairly well prescribed and based on years of trial and error in data gathering, this is not so with ATP monitoring. So, when it comes to the “M” part of the equation, we lack a model that we can readily use, and we cannot borrow a simple template from other industries (that I know of) to provide us with an easy starting point.
It is for these reasons that I would like to begin discussing the possibility of establishing standard sampling and measurement approaches that would lend consistency and repeatability to our collective efforts to apply ICM principles in evaluating sanitation, specifically, in the use of ATP monitoring.
To begin, measuring is part of sampling, and sampling is part of the validation process to ensure safe food preparation and service. Observation and sampling are the basic applied sciences that drive our profession. I therefore view the measurement part of the ICM model as a more sophisticated and objective way to evaluate “how clean is ‘clean’?” The ATP-monitoring system would provide us with a tool that would ultimately quantify “clean to sight and touch” and serve as a logical segue to advance microbiological sampling and assays to distinguish viable from non-viable biocontamination, learn more about the source(s) of possible contamination or justify identifying specific pathogenic organisms.
The ICM model relies on comparative measurements taken before, during and after a sanitation process. As such, three important events must happen even before we put swab to surface. First, a working hypothesis must be established to obtain a clear definition of what we are trying to accomplish. Second, we need to devise a sampling scheme that minimizes (or hopefully eliminates) bias in answering the questions posed in our hypothesis. And finally, we need to develop a model or standard for the interpretation of data.
The Hypothesis
It is intuitive that we do not consciously choose to evaluate a cleaning system that is less effective and more costly than the system we are trying to replace. So from the onset, we tend to approach the evaluative process with a bit of bias. The hypothesis should keep us on track. The science of epidemiology provides us with a unique approach to this initial conundrum. It is called the “null hypothesis” and, in simplest terms, states that the results observed in the experiment are no different from what might have occurred as a result of the operation of chance alone. The hypothesis assumes that the independent variables in our experiment have no association with or effect upon the dependent or outcome variables. Basically, it states: “Don’t believe everything you believe.” Once the null hypothesis is established, we can approach the ICM experiment without prejudice.
Sampling
Establishing a sampling strategy might seem quite straightforward at first glance. However, when we try to compare methods, chemicals and equipment in situ, the classic laboratory approach doesn’t exactly apply. When comparing existing sanitation protocols to new technologies and ideas, the evaluations are usually performed during regular business hours, with existing personnel and without disruption to normal operations. If this were not enough, the sampling methodology also needs to yield unbiased results. Therefore, a nonjudgmental sampling strategy that includes random-sample allocation of both location and consistency in collecting the samples will yield the best results possible.
To accomplish this, a biometrician isn’t needed per se, although he or she would be quite helpful in establishing the experimental design. In lieu of such a professional, I am an ardent proponent of using American National Standard: Sampling Procedures and Tables for Inspection by Attributes (ANSI/ASQ Z1.4-2003) or, more commonly known by its old acronym, MIL-STD-105E. It is an easy way to ensure the absence of bias in sample collection. If used correctly, a random selection of as few as two sampling sites will yield a valid, statistically correct conclusion.
Once sample numbers and frequencies are determined, the next step is to consider the sample itself. We would not think of taking a microbiological surface sample without using some form of area template as detailed in Standard Methods and other official and peer-reviewed publications. Yet, emphasizing the use of templates with an ATP-monitoring system is not a strong suit in most manufacturers’ instruction manuals. Indeed, too many investigators who use ATP devices in the field eschew templates as if they would somehow compromise their skill and acumen in using the instrument. However, in applying the ICM model—in which two different cleaning systems or cleaning materials are compared—consistency in sampling is essential to accurately measuring differences.
The standard microbiological templates are either square or round, have an area of approximately 100 cm² and are readily available through most laboratory supply houses. In the micro-sampling business, the templates are generally made of Teflon®, stainless steel or some other non-porous material capable of being sterilized. After about three years of working with ATP-monitoring systems, I have found that there are no significant differences between the use of sterile and non-sterile templates. In fact, when sampling for ATP, impervious materials are equally as good as non-porous, impervious and cleanable kinds.
For the ICM experiments of which I have been a part, I fashion templates from shirt cardboards or any rigid material (that does not contribute ATP or significant bioburden to the surface under test) to meet the conditions of the experiment, which means that I can vary the geometry of the template to meet most surface sample sites. For most of my work, however, I find that using a template of approximately 50 cm² is somewhat more manageable than a larger 100 cm² template and yields consistently comparative values. I also find two configurations that can be used in most situations: a traditional 2-inch by 2-inch square and 1-inch by 4-inch rectangle. For common touch items, such as switches, levers, door handles or any irregular shape, we decide on a sampling protocol for each of these items at the onset of sampling and use that protocol consistently throughout the experiment.
ATP-monitoring Systems
Using an ATP-monitoring system for ICM in situ comparative studies is both logical and economical. ATP is a rapid and accurate method for establishing baseline values of biocontaminant cleanliness. However, a word of caution is in order. By last count, there are approximately five manufacturers of ATP systems that supply the American market; I have four of them in my arsenal of field instruments and use each for a different and specific application in my work.
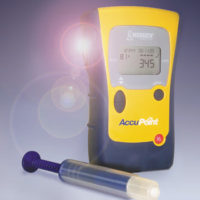
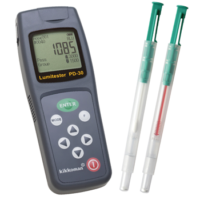
Each of my units differs from the others in almost every aspect, such as the swab systems and chemistries, the light-sensing devices, the software programs and readouts, the key-pad operation and their levels of sensitivity and methods of calibration. In fact, their diversity of design helps me in my profession. One of my units is multifunctional and can be used for measuring temperature, pH and conductivity. This is ideal when bulk sampling presents a safety hazard. Another unit can be used with multipurpose swab types. These provide me with a wide field of study, including water and allergen surrogate assays. Two of my units are very easy to operate, extremely economical and ideal for teaching purposes. Of these two units, one has a unique swabbing system that I can use on a filter medium with an air-sampling device (but more on this in a future column). In addition, three of my units are programmable, and collective data can be downloaded to my laptop computer. Two sampling systems are not overly temperature-sensitive and therefore nicely adaptable to field work. The list goes on.
The only downside to this diversity is that there exists no current standard matrix whereby applying a constant or “fudge factor” will yield comparable relative light unit (RLU) results for all systems. The only comparisons that I have seen so far in the industrial literature basically relate to their relative sensitivities and environmental interferences, shelf lives of the swab systems, ease of use and various bells and whistles unique to each manufacturer. Having said all this, there is yet another bit of information of which you should be aware when working with this technology. Nowhere in the scientific literature are any standard numbers given for cleanliness. Those that have been reported are unique to that study, with all surfaces and situations being different. Each area and surface is different from every other and should be evaluated by establishing separate baseline values and then comparing the results of cleaning activities against those values. As a general rule in enumerating microbial assays, only orders-of-magnitude differences should be considered significant. What all this means is that if you start with a given manufacturer’s unit, continue with that same unit or one from the same manufacturer. If you adapt another manufacturer’s ATP-monitoring system, you need to reestablish baseline values for cleanliness in each experiment.
Further Lessons Learned
Unlike microbiological assays where surface sampling detects some but not all living bacteria, ATP-monitoring systems detect everything. Since ATP is present in all living cells, these systems will detect anything of either plant or animal origin, including all microbes, living or dead. Therefore, establishing controls before sampling is sometimes more important than the experiment itself and must be done to rule out inaccuracies in data collection.
For instance, water used in cleaning may pass through a resin, charcoal or calcite bed or some other filtering system and may contain large numbers of heterotrophic bacteria or their equivalent cell content. Likewise, surface-water sources may have elevated ATP levels from algae, bacteria and fungi that normally live in the source water impoundment. Defining these background levels is essential to the interpretation of the results. I learned this the hard way.
Likewise, it is prudent to sample any chemical cleaners, as they are not manufactured under sterile conditions with water that has been passed through either a reverse-osmosis or a distillation process. Equipment and other materials used in the ICM experiment may have an amazing amount of ATP on their surfaces as a result of biofilms or the simple soiling that occurs during normal use. Likewise, most equipment is not reprocessed to cleanroom standards when a sanitation job is completed. If biocontamination is suspected in anything related to the experiment, it is prudent to run suitable controls to eliminate false data when working with ATP-monitoring systems.
For providing information that was valuable to me in writing this column, I would like to thank KaiVac, the International Executive Housekeepers Association (IEHA) and the following ATP system manufacturers: Biocontrol, Charm Sciences, Hygiena and Neogen.
Forensic sanitarian Robert W. Powitz, Ph.D., MPH, RS, CFSP, is principal consultant and technical director of Old Saybrook, CT-based R.W. Powitz & Associates. Contact him directly at Powitz@sanitarian.com or through his Web site at www.sanitarian.com.
Looking for a reprint of this article?
From high-res PDFs to custom plaques, order your copy today!

